

| Party | Seats | Change | Percentage | Majority Probability | Minority Probability |
|---|---|---|---|---|---|
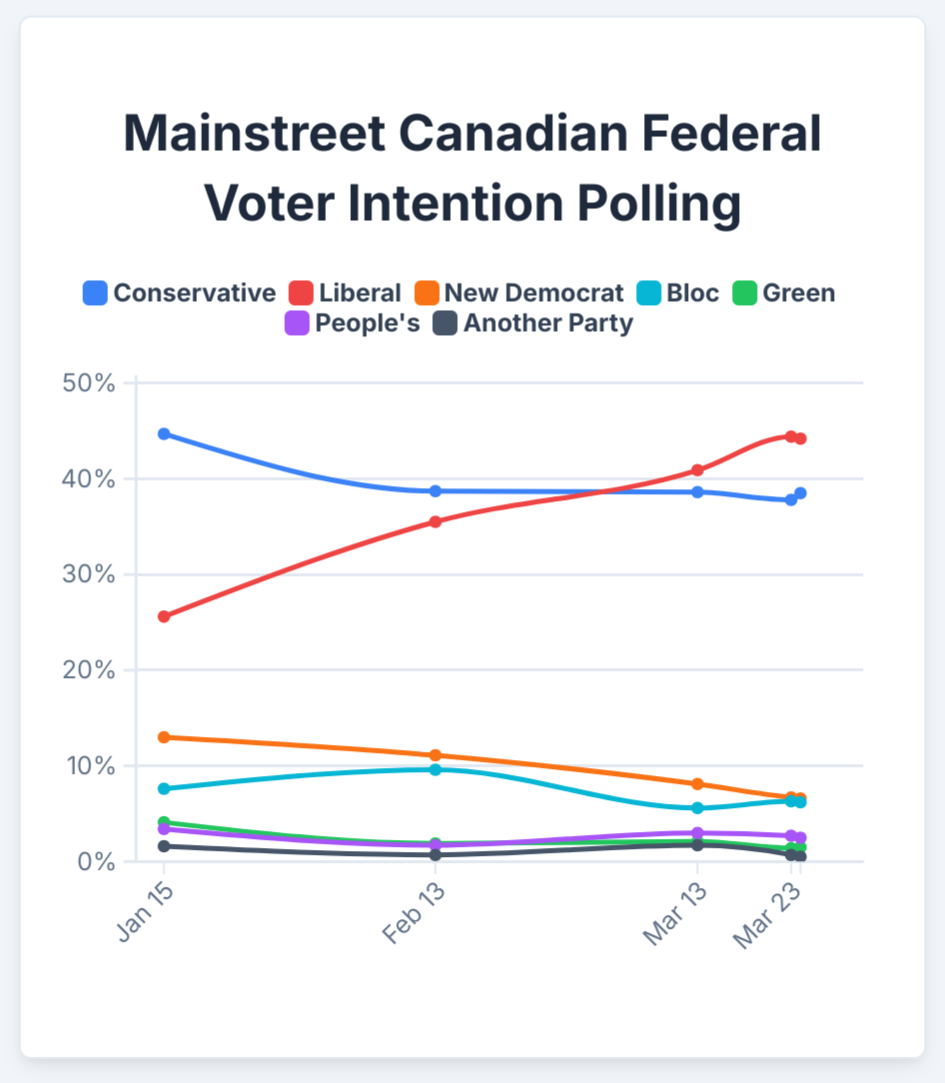
| Liberal | 190 | +37 | 44.2% | 88.1% | 11.6% |
| Conservative | 120 | -1 | 38.5% | 0.2% | 4.8% |
| Bloc | 26 | -7 | 6.2% | N/A | N/A |
| New Democrat | 6 | -19 | 6.6% | N/A | N/A |
| Green | 1 | -1 | 1.5% | N/A | N/A |
| People’s | 0 | N/A | 2.5% | N/A | N/A |
Source: https://www.mainstreetresearch.ca/dashboard/canada#voter-intention
Different day, different sample. I wouldn’t read too much into it unless it becomes a trend.